What Is Phase Imbalance?
In a balanced three-phase system, voltage and current are equal across all three phases — separated by 120° and symmetrical in magnitude. Phase imbalance occurs when this symmetry breaks down. Causes include uneven single-phase loading across the distribution network, high-resistance connections on one phase, utility supply asymmetry, or failed power factor correction (PFC) capacitors affecting one phase differentially.
The consequences are disproportionate to the degree of imbalance. The NEMA MG1 standard establishes a well-known relationship: a voltage imbalance of 1% produces a current imbalance of approximately 6–10 times that value in three-phase motors. A motor running under 5% voltage imbalance will derate significantly, operate at elevated winding temperature, and experience substantially reduced bearing and insulation life.
6–10×
current imbalance produced per 1% voltage imbalance (NEMA MG1)
5%
voltage imbalance causes significant motor derating and overheating
40%
minimum system load required for reliable thermographic detection
How Thermography Detects Phase Imbalance
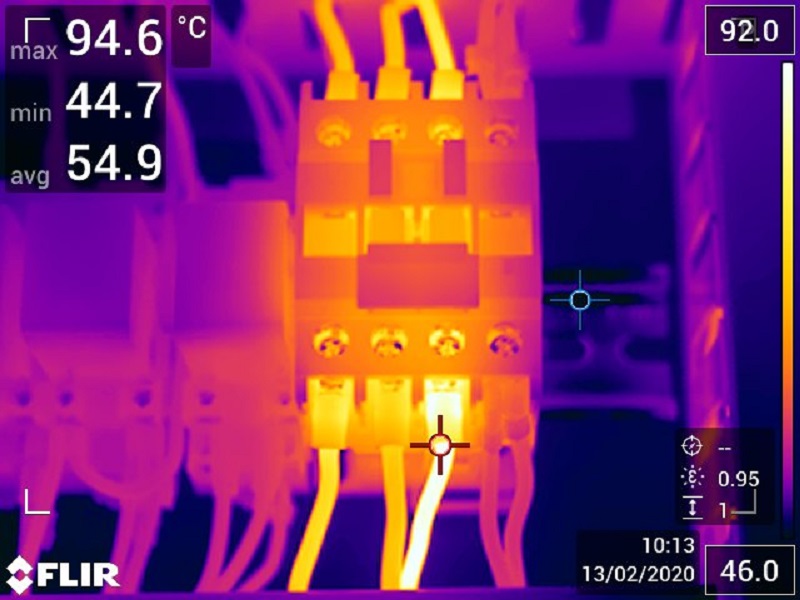
Thermography does not measure voltage or current directly. It detects the thermal consequence of imbalance. In a balanced three-phase distribution board or MCC, all three phases display comparable thermal signatures under equivalent load. Asymmetry in the thermogram — one phase busbar, cable lug, or breaker terminal running measurably hotter than its counterparts — indicates a load, resistance, or connection problem specific to that phase.
The thermographer assesses each panel systematically, comparing phase-to-phase temperatures at equivalent points in the circuit. A balanced three-phase load will produce three nearly identical thermal signatures. Any significant deviation is documented, measured, and classified.
ΔT Classification — What the Numbers Mean
Phase-to-phase ΔT is the primary diagnostic value. Context is critical — load at the time of inspection must be recorded because ΔT is meaningless without it.
- ΔT 1–3°C between phases — minor imbalance, monitor at next survey. Common in systems with minor load asymmetry.
- ΔT 4–10°C between phases — moderate imbalance. Investigate load distribution and check termination torque on the hot phase. Schedule corrective action within 30 days (P3).
- ΔT 11–20°C between phases — significant imbalance. High-resistance joint or severe load imbalance probable. Remediate within 7 days (P2).
- ΔT greater than 20°C between phases — severe imbalance. Immediate investigation required. Motor and connected equipment at risk. P1 classification if failure risk is imminent.
Load context is mandatory
A ΔT of 8°C between phases at 20% load is a very different finding from the same ΔT at 90% load. Enisave Solutions records system load at the time of every panel inspection, ensuring that severity classifications are based on contextually accurate measurements rather than raw temperature readings in isolation.
Where Phase Imbalance Originates
The thermographic report identifies the thermal asymmetry but also attempts to localise its source. Phase imbalance can originate at three levels:
- Utility supply level — voltage asymmetry from the grid affects all equipment on the installation. If imbalance is present at the main incomer but absent at sub-distribution boards, a utility supply fault is indicated. The appropriate response is a formal complaint to the utility with voltage measurement data.
- Distribution level — uneven single-phase loads allocated unevenly across the three phases of a distribution board. Common in retail, commercial office, and mixed-use facilities. The corrective action is load rebalancing across phases.
- Termination level — a high-resistance connection on one phase, caused by a loose lug, corroded contact, or incorrect termination method. The hot phase shows elevated temperature at the specific termination point rather than uniformly across the phase conductor. Corrective action is re-termination and torque verification.
Motor Impact — The Hidden Cost of Phase Imbalance
Motors are the equipment most directly damaged by phase imbalance. The elevated current on the high-current phase increases winding temperature, accelerating insulation degradation. The asymmetric magnetic forces increase mechanical stress on the rotor and bearings. Both effects reduce motor life and increase the probability of failure.
A motor running under sustained phase imbalance will frequently show elevated bearing temperatures detectable by thermography before winding failure occurs. Combined electrical and mechanical thermographic assessment — scanning both the supply-side distribution equipment and the motor itself — provides the most complete picture of imbalance-related risk.
Trending Across Surveys
Phase imbalance findings benefit from trending across multiple annual surveys. A ΔT of 4°C on a known connection that was 2°C on the previous survey indicates progressive degradation — the failure trajectory is accelerating. Enisave Solutions documents trending data across all repeat-client surveys, enabling maintenance teams to prioritise interventions and schedule planned outages rather than respond to unplanned failures.
Assess Your Three-Phase System
Enisave Solutions conducts live-load electrical thermographic surveys across KZN, Gauteng, Western Cape, and Eastern Cape. Reports within 24 hours.
Request a Survey Quote